Time Series Forecasting
Contents
Time Series Forecasting#
Summary#
Using all recorded annual temperatures averages (from 1850 to 2020), I use Prophet to forecast annual temperatures for the next two decades.
Data Source#
Average northern hemisphere temperature data was obtained from https://www.metoffice.gov.uk/hadobs/hadcrut5/, specifically the “HadCRUT5 analysis time series: ensemble means and uncertainties”. The temperatures are expressed as deviations, or anomalies, from reference temperatures over the period of 1961–1990; for details see here. Each anomaly is a best estimate calculated from an ensemble of 100 time series, hence confidence intervals are present in the dataset. For the purposes of this analysis, I will just use the point estimate.
Data Exploration#
Let’s load in the data and examine it:
Note
You can run and modify the code on this page Jupyter Notebook style, but without leaving the page! Hover over the launch button at the top of the page, then click the Live Code button. If you prefer a Jupyter environment, use the Binder button instead.
You’ll need to run the following cell manually because Live Code sessions assume a cwd of the root directory.
Refresh the page to revert to the original view.
import os

try:
    os.chdir("./website/stat-ml/")
except FileNotFoundError:
    pass
print(f"cwd: {os.getcwd()}")
cwd: /home/adam/projects/website/website/stat-ml
import matplotlib.pyplot as plt
import pandas as pd

df = pd.read_csv("./globwarm.csv")
df.head(3)
| Time | Anomaly (deg C) | Lower confidence limit (2.5%) | Upper confidence limit (97.5%) | |
|---|---|---|---|---|
| 0 | 1850 | -0.435791 | -0.635680 | -0.235902 |
| 1 | 1851 | -0.219249 | -0.428398 | -0.010100 |
| 2 | 1852 | -0.235702 | -0.457689 | -0.013715 |
df.tail(3)
| Time | Anomaly (deg C) | Lower confidence limit (2.5%) | Upper confidence limit (97.5%) | |
|---|---|---|---|---|
| 169 | 2019 | 1.143743 | 1.108290 | 1.179197 |
| 170 | 2020 | 1.275727 | 1.236863 | 1.314590 |
| 171 | 2021 | 1.004906 | 0.764207 | 1.245604 |
Since 2021 data collection is still ongoing, the confidence limits are much wider. For simplicity, I’ll drop this point from the analysis.
df = df[df.Time <= 2020]
Next, let’s plot the data:
fig, ax = plt.subplots()
ax.plot(df.Time, df["Anomaly (deg C)"], "o")
ax.set(xlabel="Year", ylabel="Temperature (C)")
plt.show()
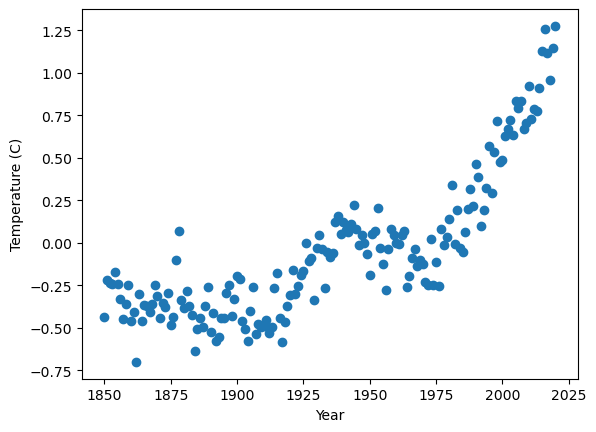
There is also clearly a nonlinear trend amidst the random variation from year to year. We also expect some long term cyclical patterns, for instance Milankovitch cycles due to variations in Earth’s movement relative to the Sun. However, these patterns are difficult to extract because we have just under 200 years of data to work with. These cyclical patterns are very important, however, because we don’t have access to more granular data with daily, weekly, and/or yearly variation typically present in business problems. For this reason, Prophet is useful as it can easily implement custom seasonalities. It’s also flexible in its ability to detect changepoints, another crucial parameter affecting model fit as we will see next.
Building a Simple Forecast#
First, we must format the data appropriately.
Prophet expects a two column dataframe with datestamps ds formatted like YYYY-MM-DD and numeric data y.
def format_years(years):
    """Convert numeric years to YYYY-MM-DD format, using an arbitrary day."""
    ds = [str(year) + "-12-31" for year in years]
    return ds


df = df[["Time", "Anomaly (deg C)"]].rename(
    columns={"Time": "ds", "Anomaly (deg C)": "y"}
)
df.ds = format_years(df.ds)
df.head(3)
| ds | y | |
|---|---|---|
| 0 | 1850-12-31 | -0.435791 |
| 1 | 1851-12-31 | -0.219249 |
| 2 | 1852-12-31 | -0.235702 |
df.tail(3)
| ds | y | |
|---|---|---|
| 168 | 2018-12-31 | 0.959662 |
| 169 | 2019-12-31 | 1.143743 |
| 170 | 2020-12-31 | 1.275727 |
df is now ready for Prophet modeling, but as hinted in § Data Exploration, a model built from defaults performs very poorly:
from prophet import Prophet


def plot_model_fit(model, df):
    """Fit and plot predictions of a Prophet() model on the training data."""
    model.fit(df)
    predictions = model.predict()
    model.plot(predictions, xlabel="Year", ylabel="Temperature (C)")


model = Prophet()
plot_model_fit(model, df)
Importing plotly failed. Interactive plots will not work.
INFO:prophet:Disabling weekly seasonality. Run prophet with weekly_seasonality=True to override this.
INFO:prophet:Disabling daily seasonality. Run prophet with daily_seasonality=True to override this.
/home/adam/projects/website/env/lib/python3.9/site-packages/prophet/forecaster.py:896: FutureWarning: The frame.append method is deprecated and will be removed from pandas in a future version. Use pandas.concat instead.
  components = components.append(new_comp)
/home/adam/projects/website/env/lib/python3.9/site-packages/prophet/forecaster.py:896: FutureWarning: The frame.append method is deprecated and will be removed from pandas in a future version. Use pandas.concat instead.
  components = components.append(new_comp)
/home/adam/projects/website/env/lib/python3.9/site-packages/prophet/forecaster.py:896: FutureWarning: The frame.append method is deprecated and will be removed from pandas in a future version. Use pandas.concat instead.
  components = components.append(new_comp)
Initial log joint probability = -17.5035
    Iter      log prob        ||dx||      ||grad||       alpha      alpha0  # evals  Notes
      99       217.559   0.000640947       66.6814           1           1      128
    Iter      log prob        ||dx||      ||grad||       alpha      alpha0  # evals  Notes
     188       218.511    0.00158703       88.0943   2.803e-05       0.001      286  LS failed, Hessian reset
     199       218.616   5.91156e-05       56.8093     0.07449           1      306
    Iter      log prob        ||dx||      ||grad||       alpha      alpha0  # evals  Notes
     292       218.705   2.68884e-05       64.9809   3.837e-07       0.001      470  LS failed, Hessian reset
     299       218.705   5.18845e-06       67.2586           1           1      478
    Iter      log prob        ||dx||      ||grad||       alpha      alpha0  # evals  Notes
     334       218.706   2.36909e-06        77.496   3.097e-08       0.001      563  LS failed, Hessian reset
     342       218.706   1.90175e-09       66.7851     0.03287     0.03287      575
Optimization terminated normally:
  Convergence detected: absolute parameter change was below tolerance
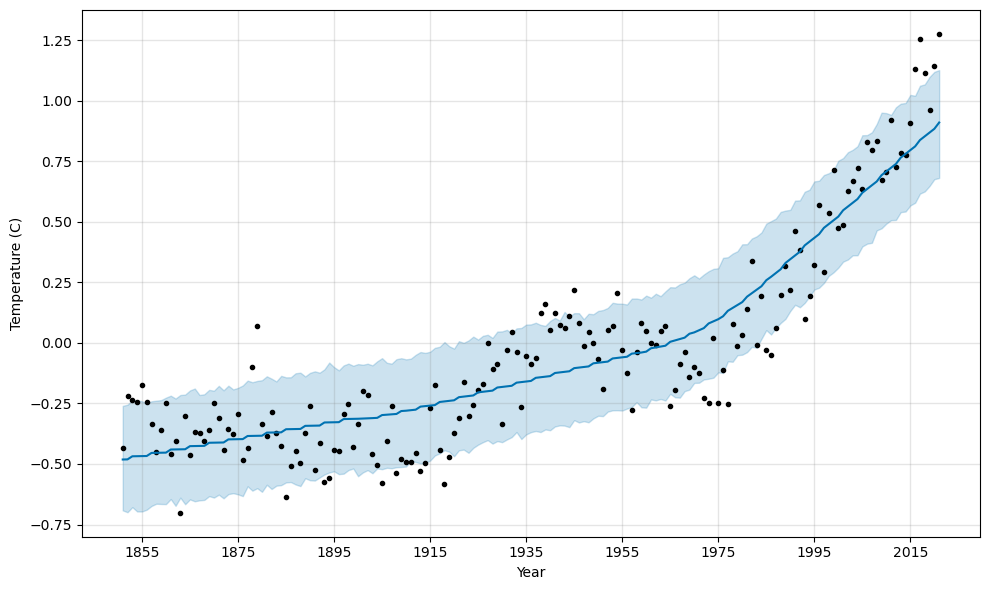
The reason is that we need to account for long term cycles over many years.
A yearly seasonality is meaningless in this context, because we don’t have sub-year level data.
Let’s try again, disabling the usual seasonalities and implementing our own using the add_seasonality() method.
From the scatterplot of the raw data, any noticeable variation occurs after at least 50 years.
At this scale, the variation is relatively small, so the fit shouldn’t be too flexible.
In other words, we shouldn’t include too many Fourier terms, controlled by the fourier_order parameter.
model = Prophet(
    daily_seasonality=False,
    weekly_seasonality=False,
    yearly_seasonality=False,
)
model.add_seasonality("50 years", period=365 * 50, fourier_order=2)
plot_model_fit(model, df)
/home/adam/projects/website/env/lib/python3.9/site-packages/prophet/forecaster.py:896: FutureWarning: The frame.append method is deprecated and will be removed from pandas in a future version. Use pandas.concat instead.
  components = components.append(new_comp)
/home/adam/projects/website/env/lib/python3.9/site-packages/prophet/forecaster.py:896: FutureWarning: The frame.append method is deprecated and will be removed from pandas in a future version. Use pandas.concat instead.
  components = components.append(new_comp)
/home/adam/projects/website/env/lib/python3.9/site-packages/prophet/forecaster.py:896: FutureWarning: The frame.append method is deprecated and will be removed from pandas in a future version. Use pandas.concat instead.
  components = components.append(new_comp)
Initial log joint probability = -17.5035
    Iter      log prob        ||dx||      ||grad||       alpha      alpha0  # evals  Notes
      53       218.827     0.0054749       100.245   5.445e-05       0.001       94  LS failed, Hessian reset
      86       219.303   0.000428905       65.8946   5.252e-06       0.001      191  LS failed, Hessian reset
      99       219.314   7.47284e-06       41.2342      0.5794      0.5794      211
    Iter      log prob        ||dx||      ||grad||       alpha      alpha0  # evals  Notes
     160       219.835   0.000219902       48.0568   4.058e-06       0.001      343  LS failed, Hessian reset
     193       219.863   0.000114599       67.8428   1.766e-06       0.001      422  LS failed, Hessian reset
     199       219.865    2.8985e-06       48.9324      0.2933      0.2933      429
    Iter      log prob        ||dx||      ||grad||       alpha      alpha0  # evals  Notes
     219       219.866   1.76065e-06         49.44   3.818e-08       0.001      492  LS failed, Hessian reset
     234       219.866   9.82303e-09        50.957     0.09921     0.09921      514
Optimization terminated normally:
  Convergence detected: absolute parameter change was below tolerance
The fit’s a bit better in terms of smoothness, but still not great.
Increasing fourier_order just amounts to more more variation around a similar mean trend line.
Let’s try increasing the seasonality period a bit more:
model = Prophet(
    daily_seasonality=False,
    weekly_seasonality=False,
    yearly_seasonality=False,
)
model.add_seasonality("centuryly", period=365 * 100, fourier_order=2)
plot_model_fit(model, df)
/home/adam/projects/website/env/lib/python3.9/site-packages/prophet/forecaster.py:896: FutureWarning: The frame.append method is deprecated and will be removed from pandas in a future version. Use pandas.concat instead.
  components = components.append(new_comp)
/home/adam/projects/website/env/lib/python3.9/site-packages/prophet/forecaster.py:896: FutureWarning: The frame.append method is deprecated and will be removed from pandas in a future version. Use pandas.concat instead.
  components = components.append(new_comp)
/home/adam/projects/website/env/lib/python3.9/site-packages/prophet/forecaster.py:896: FutureWarning: The frame.append method is deprecated and will be removed from pandas in a future version. Use pandas.concat instead.
  components = components.append(new_comp)
Initial log joint probability = -17.5035
    Iter      log prob        ||dx||      ||grad||       alpha      alpha0  # evals  Notes
      95       248.116   5.36108e-05       42.8226   8.505e-07       0.001      168  LS failed, Hessian reset
      99       248.117   5.87883e-06       49.9379      0.8928     0.08928      175
    Iter      log prob        ||dx||      ||grad||       alpha      alpha0  # evals  Notes
     158       248.125   4.68896e-07        57.519   8.193e-09       0.001      306  LS failed, Hessian reset
     163       248.125   8.11851e-09       51.7867      0.1544      0.1544      312
Optimization terminated normally:
  Convergence detected: absolute parameter change was below tolerance
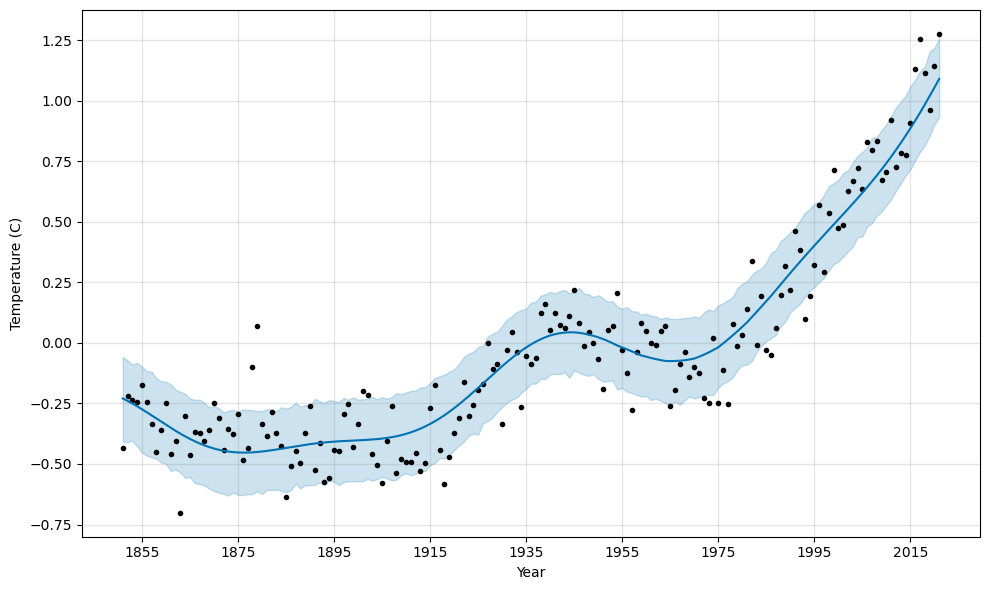
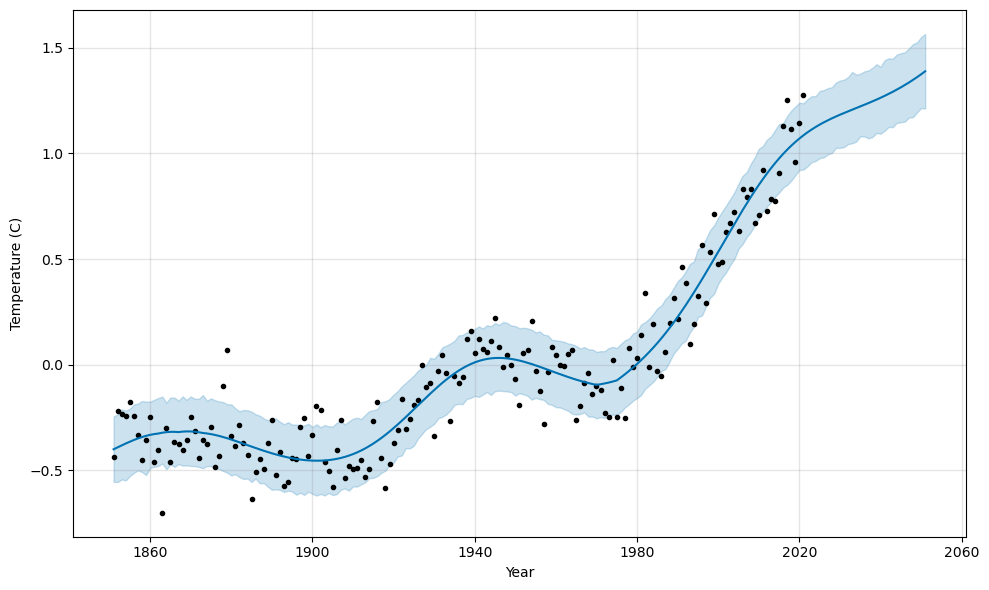
The fit is much better. Let’s see what it forecasts.
future = model.make_future_dataframe(periods=30, freq="Y")
forecast = model.predict(future)
model.plot(forecast, xlabel="Year", ylabel="Temperature (C)")
plt.show()
/home/adam/projects/website/env/lib/python3.9/site-packages/prophet/forecaster.py:896: FutureWarning: The frame.append method is deprecated and will be removed from pandas in a future version. Use pandas.concat instead.
  components = components.append(new_comp)
/home/adam/projects/website/env/lib/python3.9/site-packages/prophet/forecaster.py:896: FutureWarning: The frame.append method is deprecated and will be removed from pandas in a future version. Use pandas.concat instead.
  components = components.append(new_comp)
The model stays roughly linear with the latest data, but levels off due to the seasonality built into the model.
Optimizing the Forecast#
The previous hand-tuning was insightful, but largely experimental. A more principled approach tunes the parameters based on some performance metric(s). Cross-validation is often used for this, but we have to be a bit careful with time series data due to correlations between data points. One approach preserves the ordering of time by training on the first (say) 100 years of data and testing on the next 20 years of data. Then we train on the first 110 years of data and again test on the next 20 years of data. We repeat this until we reach the end of the data. Each batch gives us an estimate of errors of predictions made 1, 2, …, 20 years in the future while preserving the ordering of time. This approach can be implemented in Prophet as follows:
from prophet.diagnostics import cross_validation

df_cv = cross_validation(model, initial="36500 days", horizon="7300 days")
df_cv.head(3)
INFO:prophet:Making 6 forecasts with cutoffs between 1951-01-18 00:00:00 and 2001-01-05 00:00:00
/home/adam/projects/website/env/lib/python3.9/site-packages/prophet/forecaster.py:896: FutureWarning: The frame.append method is deprecated and will be removed from pandas in a future version. Use pandas.concat instead.
  components = components.append(new_comp)
/home/adam/projects/website/env/lib/python3.9/site-packages/prophet/forecaster.py:896: FutureWarning: The frame.append method is deprecated and will be removed from pandas in a future version. Use pandas.concat instead.
  components = components.append(new_comp)
/home/adam/projects/website/env/lib/python3.9/site-packages/prophet/forecaster.py:896: FutureWarning: The frame.append method is deprecated and will be removed from pandas in a future version. Use pandas.concat instead.
  components = components.append(new_comp)
Initial log joint probability = -5.25924
    Iter      log prob        ||dx||      ||grad||       alpha      alpha0  # evals  Notes
      75       127.229   9.68385e-10       101.584     0.09599     0.09599       96
Optimization terminated normally:
  Convergence detected: absolute parameter change was below tolerance
/home/adam/projects/website/env/lib/python3.9/site-packages/prophet/forecaster.py:896: FutureWarning: The frame.append method is deprecated and will be removed from pandas in a future version. Use pandas.concat instead.
  components = components.append(new_comp)
/home/adam/projects/website/env/lib/python3.9/site-packages/prophet/forecaster.py:896: FutureWarning: The frame.append method is deprecated and will be removed from pandas in a future version. Use pandas.concat instead.
  components = components.append(new_comp)
/home/adam/projects/website/env/lib/python3.9/site-packages/prophet/forecaster.py:896: FutureWarning: The frame.append method is deprecated and will be removed from pandas in a future version. Use pandas.concat instead.
  components = components.append(new_comp)
Initial log joint probability = -5.36242
    Iter      log prob        ||dx||      ||grad||       alpha      alpha0  # evals  Notes
      99       139.461   9.76843e-05       103.123      0.7929      0.7929      120
    Iter      log prob        ||dx||      ||grad||       alpha      alpha0  # evals  Notes
     143       139.524   4.58751e-05       102.166   4.693e-07       0.001      204  LS failed, Hessian reset
     168       139.527    7.1662e-09       100.937      0.1476      0.1476      239
Optimization terminated normally:
  Convergence detected: absolute parameter change was below tolerance
/home/adam/projects/website/env/lib/python3.9/site-packages/prophet/forecaster.py:896: FutureWarning: The frame.append method is deprecated and will be removed from pandas in a future version. Use pandas.concat instead.
  components = components.append(new_comp)
/home/adam/projects/website/env/lib/python3.9/site-packages/prophet/forecaster.py:896: FutureWarning: The frame.append method is deprecated and will be removed from pandas in a future version. Use pandas.concat instead.
  components = components.append(new_comp)
/home/adam/projects/website/env/lib/python3.9/site-packages/prophet/forecaster.py:896: FutureWarning: The frame.append method is deprecated and will be removed from pandas in a future version. Use pandas.concat instead.
  components = components.append(new_comp)
Initial log joint probability = -5.73025
    Iter      log prob        ||dx||      ||grad||       alpha      alpha0  # evals  Notes
      99       153.794   3.71888e-06       105.159       0.349           1      126
    Iter      log prob        ||dx||      ||grad||       alpha      alpha0  # evals  Notes
     138       153.795   7.36488e-09       106.455      0.4683      0.4683      176
Optimization terminated normally:
  Convergence detected: absolute parameter change was below tolerance
/home/adam/projects/website/env/lib/python3.9/site-packages/prophet/forecaster.py:896: FutureWarning: The frame.append method is deprecated and will be removed from pandas in a future version. Use pandas.concat instead.
  components = components.append(new_comp)
/home/adam/projects/website/env/lib/python3.9/site-packages/prophet/forecaster.py:896: FutureWarning: The frame.append method is deprecated and will be removed from pandas in a future version. Use pandas.concat instead.
  components = components.append(new_comp)
/home/adam/projects/website/env/lib/python3.9/site-packages/prophet/forecaster.py:896: FutureWarning: The frame.append method is deprecated and will be removed from pandas in a future version. Use pandas.concat instead.
  components = components.append(new_comp)
Initial log joint probability = -6.64014
    Iter      log prob        ||dx||      ||grad||       alpha      alpha0  # evals  Notes
      82       164.752   0.000308592       101.842   3.108e-06       0.001      141  LS failed, Hessian reset
      99       164.769   1.70261e-06       99.5116      0.5224      0.5224      162
    Iter      log prob        ||dx||      ||grad||       alpha      alpha0  # evals  Notes
     117       164.769   8.94213e-09       99.2085       0.177       0.177      184
Optimization terminated normally:
  Convergence detected: absolute parameter change was below tolerance
/home/adam/projects/website/env/lib/python3.9/site-packages/prophet/forecaster.py:896: FutureWarning: The frame.append method is deprecated and will be removed from pandas in a future version. Use pandas.concat instead.
  components = components.append(new_comp)
/home/adam/projects/website/env/lib/python3.9/site-packages/prophet/forecaster.py:896: FutureWarning: The frame.append method is deprecated and will be removed from pandas in a future version. Use pandas.concat instead.
  components = components.append(new_comp)
/home/adam/projects/website/env/lib/python3.9/site-packages/prophet/forecaster.py:896: FutureWarning: The frame.append method is deprecated and will be removed from pandas in a future version. Use pandas.concat instead.
  components = components.append(new_comp)
Initial log joint probability = -14.1508
    Iter      log prob        ||dx||      ||grad||       alpha      alpha0  # evals  Notes
      88       163.574      0.001071       107.114   9.956e-06       0.001      160  LS failed, Hessian reset
      99       163.666   0.000165312       102.358      0.9734      0.9734      172
    Iter      log prob        ||dx||      ||grad||       alpha      alpha0  # evals  Notes
     182       163.726   6.51677e-09       95.6481      0.2608      0.2608      276
Optimization terminated normally:
  Convergence detected: absolute parameter change was below tolerance
/home/adam/projects/website/env/lib/python3.9/site-packages/prophet/forecaster.py:896: FutureWarning: The frame.append method is deprecated and will be removed from pandas in a future version. Use pandas.concat instead.
  components = components.append(new_comp)
/home/adam/projects/website/env/lib/python3.9/site-packages/prophet/forecaster.py:896: FutureWarning: The frame.append method is deprecated and will be removed from pandas in a future version. Use pandas.concat instead.
  components = components.append(new_comp)
/home/adam/projects/website/env/lib/python3.9/site-packages/prophet/forecaster.py:896: FutureWarning: The frame.append method is deprecated and will be removed from pandas in a future version. Use pandas.concat instead.
  components = components.append(new_comp)
Initial log joint probability = -12.6326
    Iter      log prob        ||dx||      ||grad||       alpha      alpha0  # evals  Notes
      99       151.557   4.53253e-06       54.8127      0.5863      0.5863      139
    Iter      log prob        ||dx||      ||grad||       alpha      alpha0  # evals  Notes
     174       151.578   5.73067e-05       84.3149   7.726e-07       0.001      277  LS failed, Hessian reset
     199        151.58   2.07059e-07       47.3968      0.3915      0.3915      310
    Iter      log prob        ||dx||      ||grad||       alpha      alpha0  # evals  Notes
     232        151.58   6.29633e-09       67.7881      0.2082           1      358
Optimization terminated normally:
  Convergence detected: absolute parameter change was below tolerance
| ds | yhat | yhat_lower | yhat_upper | y | cutoff | |
|---|---|---|---|---|---|---|
| 0 | 1951-12-31 | -0.006353 | -0.166391 | 0.143413 | 0.053849 | 1951-01-18 |
| 1 | 1952-12-31 | -0.015820 | -0.169072 | 0.145026 | 0.069817 | 1951-01-18 |
| 2 | 1953-12-31 | -0.025520 | -0.173296 | 0.125185 | 0.206579 | 1951-01-18 |
df_cv.tail(3)
| ds | yhat | yhat_lower | yhat_upper | y | cutoff | |
|---|---|---|---|---|---|---|
| 117 | 2018-12-31 | 0.104307 | -0.092542 | 0.308903 | 0.959662 | 2001-01-05 |
| 118 | 2019-12-31 | 0.115870 | -0.081466 | 0.311119 | 1.143743 | 2001-01-05 |
| 119 | 2020-12-31 | 0.129318 | -0.085928 | 0.320792 | 1.275727 | 2001-01-05 |
For example, we see the the first cutoff point is in 1960.
The model is trained on data up until the cutoff, then predictions (yhat) are made for the next 20 years.
The cutoff points are then incremented by 10 years until 2000.
I’ll measure model performance using mean squared error (MSE), but a variety of metrics could be used.
We can plot MSE as a function of horizon length (how far in time the prediction is made) using plot_cross_validation_metric();
unsurprisingly, performance is worse the farther out the window:
from prophet.plot import plot_cross_validation_metric

fig, ax = plt.subplots(figsize=(10, 6))
plot_cross_validation_metric(df_cv, metric="mse", rolling_window=0.1, ax=ax, color="C0")
plot_cross_validation_metric(df_cv, metric="mse", rolling_window=0.5, ax=ax, color="C1")
plt.show()
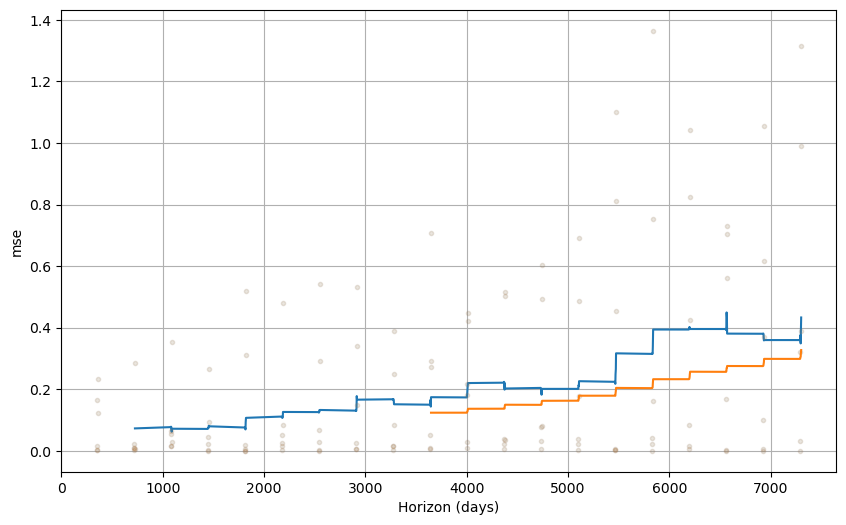
The two curves differ by the amount of averaging used in computing the MSE.
Each point in the blue curved is averaged over 10% of the data while the orange curve is averaged over 50% of the data.
The blue curve is more variable but can give estimates over shorter horizons.
Setting rolling_window=1 averages over all the data, giving just a single average estimate for the MSE predicting within a 20 year horizon.
A dataframe of metrics can be extracted with performance_metrics():
from prophet.diagnostics import performance_metrics

df_performance = performance_metrics(df_cv, rolling_window=1)
df_performance
| horizon | mse | rmse | mae | mape | mdape | smape | coverage | |
|---|---|---|---|---|---|---|---|---|
| 0 | 7300 days | 0.225348 | 0.474709 | 0.358713 | 3.293734 | 1.071312 | 1.544548 | 0.383333 |
The above code with rolling_window=1 is useful for hyperparameter tuning.
It allows us to optimizing average performance over a fixed horizon window.
This is done in the code below to find the optimum seasonality period and number of Fourier terms.
I also optimize over two model parameters changepoint_prior_scale and seasonality_prior_scale which control the flexibility of the changepoints and seasonalities.
import itertools

def make_grid_combinations(grid):
    """Turn a dictionary of grid points into a dictionary of all combinations
    of those grid points."""
    all_params = []
    for vals in itertools.product(*grid.values()):
        all_params.append(dict(zip(grid.keys(), vals)))
    return all_params

param_grid = {
    'period': [50, 75, 100],
    'fourier_order': [2, 4, 6],
    'changepoint_prior_scale': [.005, .05, .5],
    'seasonality_prior_scale': [.1, 1, 10],
}
all_params = make_grid_combinations(param_grid)
mses = []

# Cross-validate each combination of grid parameters to estimate MSEs
for params in all_params:
    model = Prophet(
        daily_seasonality = False,
        weekly_seasonality = False,
        yearly_seasonality = False,
        changepoint_prior_scale = params['changepoint_prior_scale'],
        seasonality_prior_scale = params['seasonality_prior_scale']
    )
    model.add_seasonality(
        name = str(params['period']) + ' year',
        period = 365 * params['period'],
        fourier_order = params['fourier_order']
    )
    model.fit(df)

    df_cv = cross_validation(model, initial='36500 days', horizon='7300 days')
    df_performance = performance_metrics(df_cv, rolling_window=1)
    mses.append(df_performance['mse'].values[0])

tuning_results = pd.DataFrame(all_params)
tuning_results['mse'] = mses
tuning_results.to_csv('tuning_results.csv', index=False)
The result is stored in a dataframe of cross-validated MSEs and the parameters used in the model:
tuning_results = pd.read_csv("./tuning_results.csv")
tuning_results
| period | fourier_order | changepoint_prior_scale | seasonality_prior_scale | mse | |
|---|---|---|---|---|---|
| 0 | 50 | 2 | 0.005 | 0.1 | 0.154416 |
| 1 | 50 | 2 | 0.005 | 1.0 | 0.155571 |
| 2 | 50 | 2 | 0.005 | 10.0 | 0.156148 |
| 3 | 50 | 2 | 0.050 | 0.1 | 0.152661 |
| 4 | 50 | 2 | 0.050 | 1.0 | 0.154947 |
| ... | ... | ... | ... | ... | ... |
| 76 | 100 | 6 | 0.050 | 1.0 | 0.243489 |
| 77 | 100 | 6 | 0.050 | 10.0 | 0.245329 |
| 78 | 100 | 6 | 0.500 | 0.1 | 0.108537 |
| 79 | 100 | 6 | 0.500 | 1.0 | 0.108298 |
| 80 | 100 | 6 | 0.500 | 10.0 | 0.106562 |
81 rows × 5 columns
The best parameters, measured by MSE, are easily obtained:
import numpy as np

best_params = tuning_results.iloc[np.argmin(tuning_results["mse"]), :]
best_params
period                     75.000000
fourier_order               2.000000
changepoint_prior_scale     0.500000
seasonality_prior_scale    10.000000
mse                         0.048304
Name: 35, dtype: float64
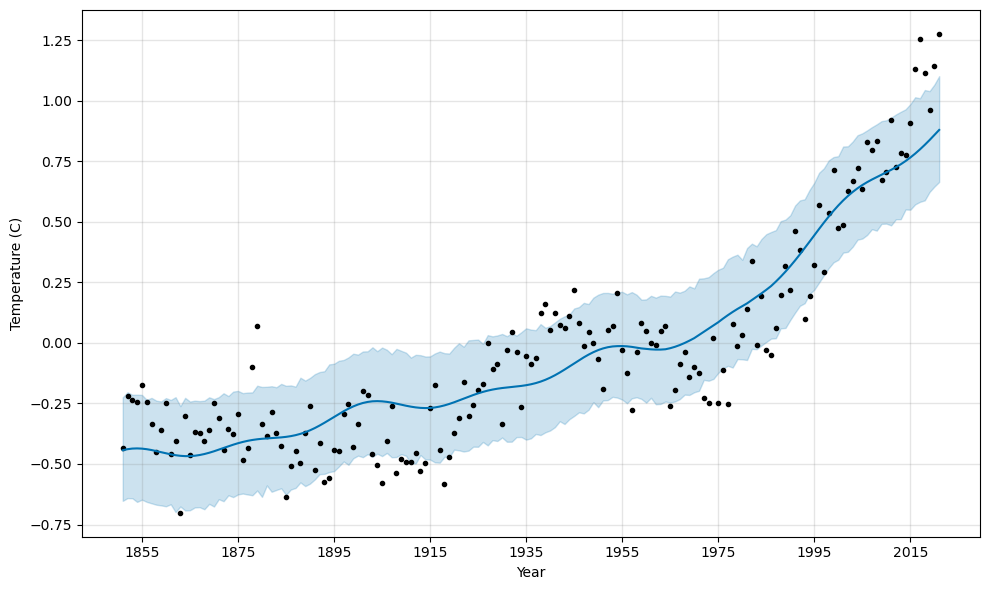
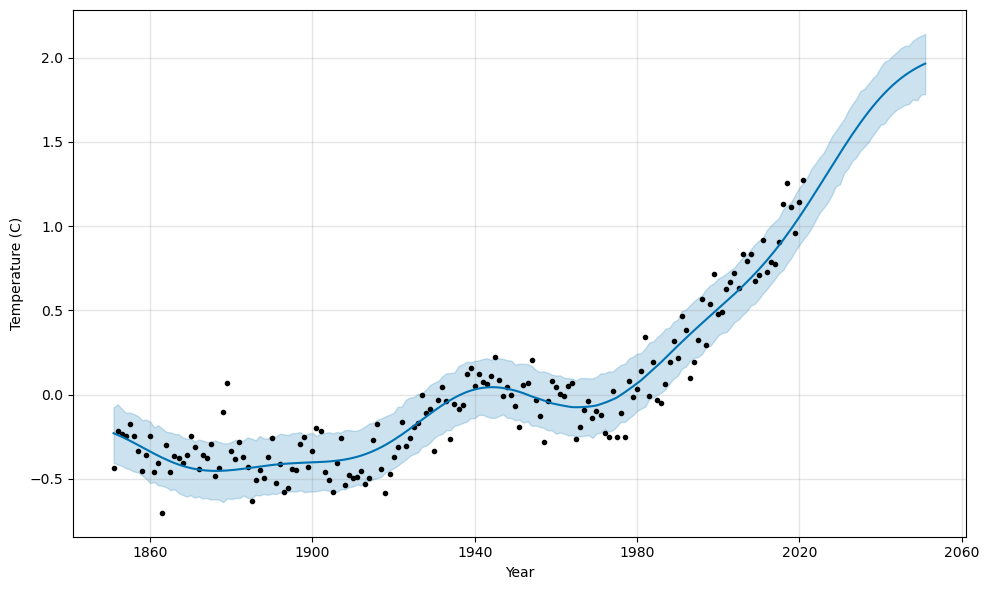
Let’s see what the optimized model looks like:
model = Prophet(
    daily_seasonality=False,
    weekly_seasonality=False,
    yearly_seasonality=False,
    changepoint_prior_scale=0.5,
    seasonality_prior_scale=10.0,
)
model.add_seasonality("centuryly", period=365 * 75, fourier_order=2)
model.fit(df)
future = model.make_future_dataframe(periods=30, freq="Y")
forecast = model.predict(future)
model.plot(forecast, xlabel="Year", ylabel="Temperature (C)")
plt.show()
/home/adam/projects/website/env/lib/python3.9/site-packages/prophet/forecaster.py:896: FutureWarning: The frame.append method is deprecated and will be removed from pandas in a future version. Use pandas.concat instead.
  components = components.append(new_comp)
/home/adam/projects/website/env/lib/python3.9/site-packages/prophet/forecaster.py:896: FutureWarning: The frame.append method is deprecated and will be removed from pandas in a future version. Use pandas.concat instead.
  components = components.append(new_comp)
/home/adam/projects/website/env/lib/python3.9/site-packages/prophet/forecaster.py:896: FutureWarning: The frame.append method is deprecated and will be removed from pandas in a future version. Use pandas.concat instead.
  components = components.append(new_comp)
Initial log joint probability = -17.5035
    Iter      log prob        ||dx||      ||grad||       alpha      alpha0  # evals  Notes
      99       302.408    0.00570823       11.3782           1           1      120
    Iter      log prob        ||dx||      ||grad||       alpha      alpha0  # evals  Notes
     119       303.216   0.000781285       20.5453   2.855e-05       0.001      185  LS failed, Hessian reset
     199       304.138   7.30153e-05        7.3618      0.4801      0.4801      290
    Iter      log prob        ||dx||      ||grad||       alpha      alpha0  # evals  Notes
     272       304.446   0.000393317       11.4501   2.713e-05       0.001      419  LS failed, Hessian reset
     299       304.522   0.000217305       7.42838      0.3201      0.3201      452
    Iter      log prob        ||dx||      ||grad||       alpha      alpha0  # evals  Notes
     346       304.735    0.00183216       21.7699   0.0001859       0.001      537  LS failed, Hessian reset
     399       304.865   0.000122705       8.81822      0.3029           1      608
    Iter      log prob        ||dx||      ||grad||       alpha      alpha0  # evals  Notes
     448       304.947   0.000699382       14.9056   8.463e-05       0.001      714  LS failed, Hessian reset
     499       304.979   2.88487e-05       7.75454      0.3058      0.3058      774
    Iter      log prob        ||dx||      ||grad||       alpha      alpha0  # evals  Notes
     551       304.984   0.000253777        7.0285   3.633e-05       0.001      887  LS failed, Hessian reset
     599       304.986   9.19244e-06       7.14222           1           1      950
    Iter      log prob        ||dx||      ||grad||       alpha      alpha0  # evals  Notes
     602       304.986   1.93406e-05       6.94598   2.726e-06       0.001      992  LS failed, Hessian reset
     625       304.986   3.04125e-07       6.87252      0.4057           1     1021
Optimization terminated normally:
  Convergence detected: relative gradient magnitude is below tolerance